Debugging remote CLI with phpstorm

Even in these days, with full-featured PHP IDEs around, I still see PHP developers using var_dump() and die() to debug
their code. Not only is this a very bad way of “debugging”, it has other dangers as well, like side-effects on calling
(non-idempotent) methods multiple times, not removing debug statements and possible even committing this to the VCS
repository, which gets send onto your production environment. We’ve probably all been there,.. But we don’t have to.
Debugging your code properly through an IDE is quite easy, but one of the major problems is debugging CLI code. Since
many frameworks like Zend, Symfony and micro-frameworks like Cilex can be used to create command-line apps, cronjobs
and even daemons, so how do we easily debug this kind of code?
The basics
One the things I do for pretty much every project, is setting up a dedicated virtualbox. With luck, this is completely automated through Vagrant/Puppet, but if not, I have a simple template of a ready-to-use development box, which I can clone and setup in a few minutes. This allows me to start each project with a (disposable) clean sheet, so I don’t have to worry about cluttering up my local development machine. After all, I don’t want to have 3 different versions of Python, 2 rubies and a bundle of PHP versions hanging around, while trying to maintain this mess and hoping that everything will still work the same on your production. Don’t develop locally, just don’t.
Anyway, once our development machine has been set up, we have a different IP/host to connect to. I don’t have a DNS
server running, so for me it’s adding a new line to my /etc/hosts file, but you could have a DNS server running that
maps your *.dev tld or something so you don’t have to worry about them. So, once our project has been setup, I can
connect to the following site:
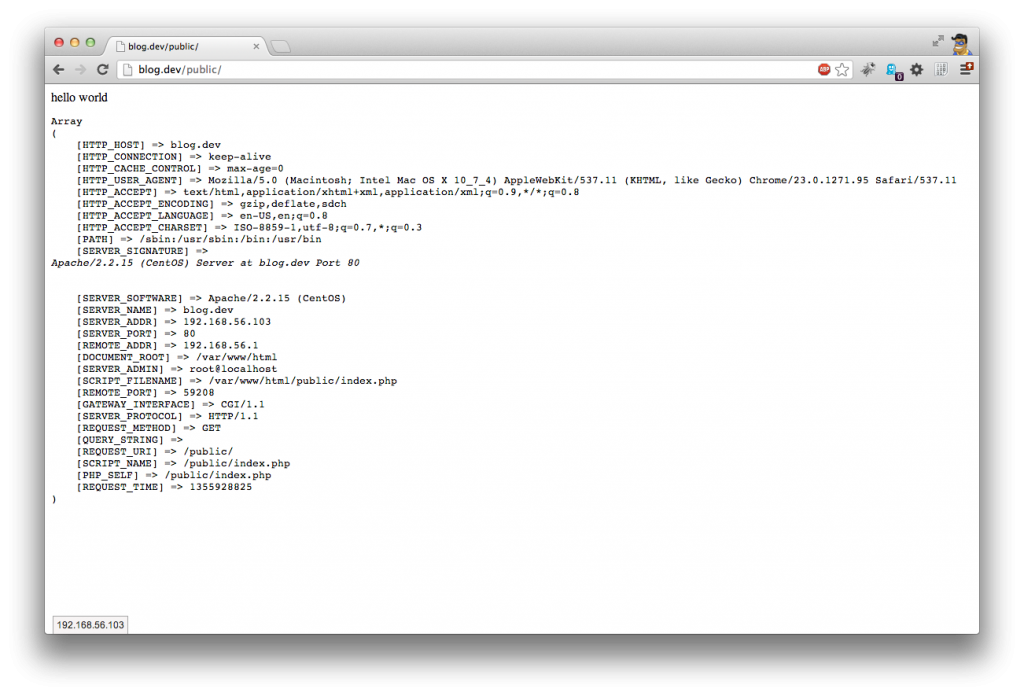
It just demonstrates that the site is working on the URL. The web-server (apache) runs the PHP module, with the xdebug extension, which I will show you a bit later on how to set up.
To actually develop this site, I either setup a samba connection, or when using vagrant, I can use a local tree (remember, having a local source tree is not the same as developing locally). I only have to setup a project in PhpStorm, which is as easy as opening a directory. PHPStorm takes care of the rest (no endless wizards to setup a project!)
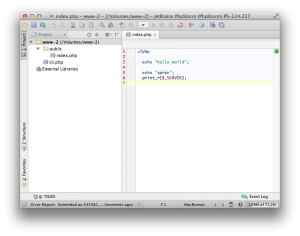
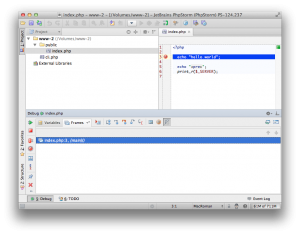
Now, normally you would have a public directory, which is your actual web-root. Your webserver will point to this directory, so everything below this path isn’t directly visible from the web-server. So it’s a bit safer and more manageable, especially with larger projects. The cli.php file - as you can see - is placed outside of the web-server root, so it’s not accesible directly from the web-server (well, if you setup your webroot that is).
Setting up XDebug
Before we can debug through our PHPStorm IDE, we have to make sure that XDebug is running on the web server. I’m not going to explain how to install this extension, because it’s very easy (pecl install xdebug, most likely), but just make sure you have the following configuration:
xdebug.remote_enable = 1
xdebug.idekey = "PhpStorm1"
xdebug.remote_autostart = 1
xdebug.remote_connect_back = 1
xdebug.remote_port = 9000
xdebug.remote_handler=dbgp
As you can see, we set the xdebug.remote_autostart, which tells xdebug to start on each request. The
xdebug.remote_connect_back is needed so xdebug knows where to connect to. This flag tells xdebug that you don’t have
to specify the IP where the IDE debugger is listening to. It assumes that the REMOTE_ADDR that can be found in the
$_SERVER superglobal array, is client where the debugger runs on. I’ve seen problems with this setup on windows
machines, where xdebug tries to open the debug-port but times out. Probably firewall settings or something.
Once you have configured the xdebug extension, you should be able to start debugging.
Debugging with PHPStorm
Press the red phone-button at the top of the toolbar in PHPStorm:

This will turn the button into a green phone-icon. This means that the PHPStorm is listening to incoming (xdebug)
connections. (you can check this by telnetting directly to the client at port 9000, if you like to test your setup).
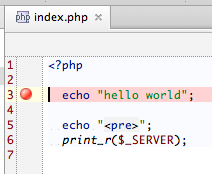
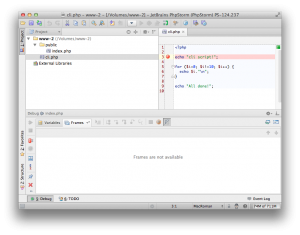
Now, let’s set a breakpoint in the first line of your code. We can do this by clicking on the gutter-bar on the line we
want to set our breakpoint at.
Once set, we can go back to the browser and refresh. This will trigger XDebug in connecting to our PHPStorm IDE, and it will trigger on the breakpoint. If it’s the first incoming connection, PHPStorm might ask for some info:
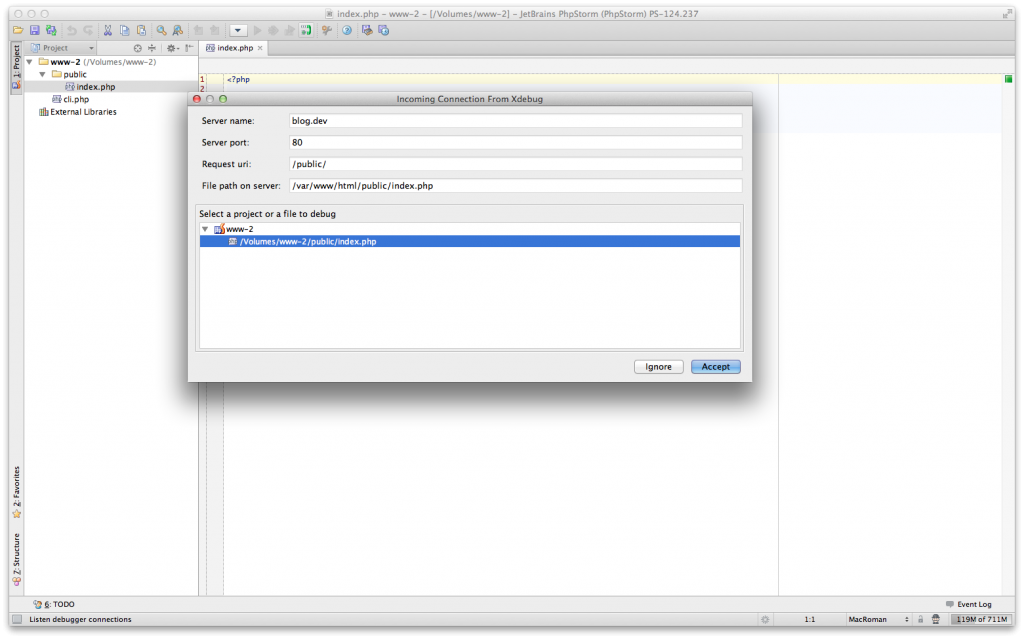
Click accept. We deal with this later. Afterwards, you would see the breakpoint being triggered:
This seems to be working. We can step through our code, we can inspect our variables and call-stack without even configuring our IDE for debugging. It’s that easy. Sweet!
Path mappings
There is one thing I always like to set right, since 99% of the time this goes wrong. This happens a lot when working
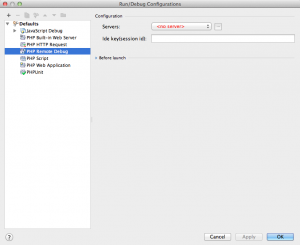
with frameworks and files outside your public web-root. Let’s go to the debug configuration settings (from the menu:
Run | Edit configurations), and click on the PHP Remote debug. You should see something like this:
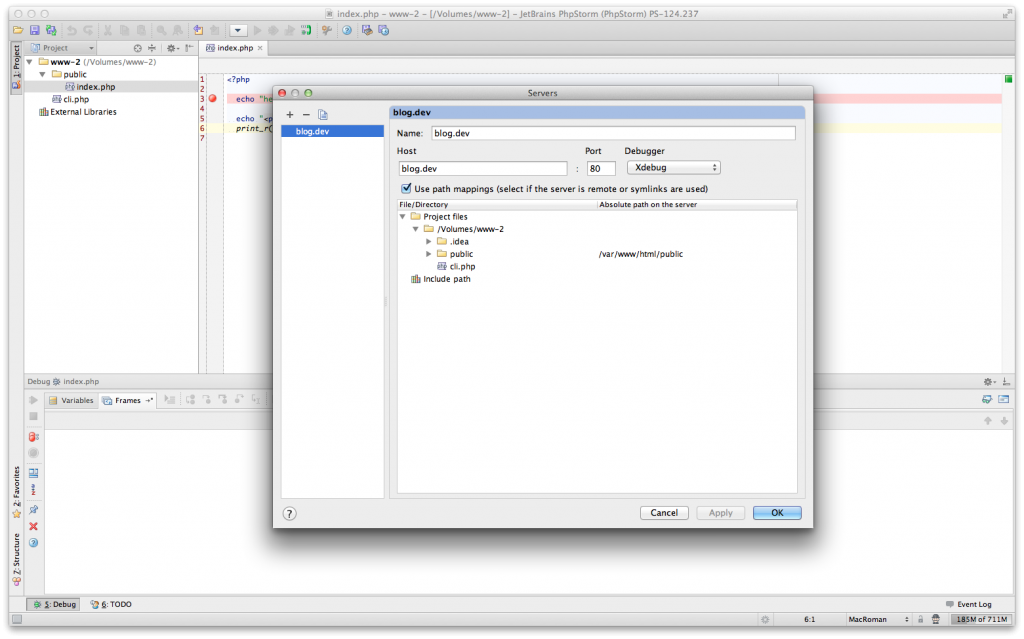
Click on the […] after the server dropdown button. You will get a screen where you can set your path mapping:
Path mappings are important. Because we are doing remote debugging, the IDE needs to know which file is which. Suppose
you set a breakpoint in index.php. This file is loaded on the server from /var/www/html/public/index.php. But your IDE
cannot find this file on this location. After all: it’s a remote file, since we are remote debugging. So somehow, we
must tell the IDE where it can find this file. Since we are using samba (or just a local directory when using vagrant),
we can just tell through the path mapping that the LOCAL path /Volumes/www-2/public points to the REMOTE path
/var/www/html/public, since the samba share (/var/www/html) is connected to my OSX path /Volumes/www-2. You probably use
a drive-letter in windows.
In effect, this tells the IDE that the remote file /var/www/html/public/index.php can be found
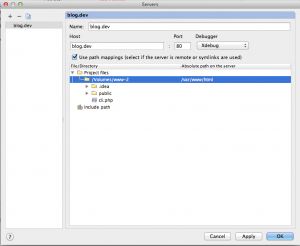
at /Volumes/www-2/public/index.php. This works perfectly for everything below your webroot:
/var/www/html/public/css/my.css will be mapped to /Volumes/www-2/public/css/my.css. However, above your web-root is not
mapped. Suppose you use a framework that is located in /var/www/html/framework/framework.php. If the IDE wants to debug
this file, it cannot find it, because there is no path mapping. This is why you should try to set your path-mapping to
the lowest path possible. In our case, we should set a path mapping from /var/www/html to /Volumes/www-2. If you have
special needs for your path mappings, you can just add them if needed, but if you setup your projects decently, you
don’t really need this. One path mapping should be enough.
This path mapping will be important for CLI debugging as well, as these paths are outside the web-root as well.
CLI Debugging
So how do we run a CLI script? Right, directly from the command-line off course. Since we are working on a remote system, we need to SSH into our system:
$ ssh jthijssen@blog.dev
jthijssen@blog$ cd /var/www/html
jthijssen@blog$ php cli.php
cli script!0
1
2
3
4
5
6
7
8
9
All done!
jthijssen@blog$
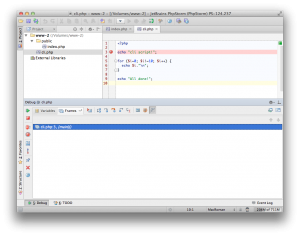
But how to debug? First off, set a debug breakpoint in our cli script:
Next up, we must do a few tricky things. First off all, remember the xdebug.remote_connect_back setting? It tells xdebug
that it needs to connect back the the REMOTE_ADDR that does the request. However, running a CLI script does not have any
$_SERVER settings like REMOTE_ADDR. How does a CLI script know to which IP it needs to connect to? The answer is that we
need to tell it manually.
We can set the xdebug.remote_host setting. But obviously we don’t want to change our xdebug.ini configuration everytime
we switch from cli to web debugging and vice versa. Although, on a system that only uses virtual machines, this might
work. But luckily, we can override these settings on the commandline pretty easily:
$ php -dxdebug.remote_host=192.168.56.1 cli.php
The IP is the actual IP of your local development system. Since I use a host-only network on each virtualbox, this is always 192.168.56.1 at my system. So at least now xdebug knows where to connect to, but we’re not done yet. You can let PHPStorm handle multiple debug configurations (like path mappings etc) for different projects and servers. So path mappings are bound to the current configuration.But which configuration are we using? When debugging a webserver, it finds the configuration based on the actual server name (blog.dev in our case).
So again, when doing CLI debugging, we must set this manually.
$ export PHP_IDE_CONFIG=serverName=blog.dev
Since we are setting an environment variable, this gets copied into the $_SERVER settings. PHPStorm checks the setting
of $_SERVER['PHP_IDE_CONFIG'], to determine the server name. This way, it will know which configuration and thus path
mappings will be used.
Hurrah! Now we can step through our CLI code and debug, just like we can in our web applications.